ReADI Could Make Neighborhood Deprivation Data More Useful for Public Health
Public health has plenty of indices designed to tell us about the places where people live.
The Social Vulnerability Index measures characteristics that can make communities particularly vulnerable during disasters and other emergencies. The Area Deprivation Index measures neighborhood socioeconomic disadvantage. Other tools measure persistent poverty, community deprivation, rurality, health care access, and related conditions.
These measures have become increasingly important because public health agencies, health systems, foundations, and government programs routinely use geography to decide where to concentrate resources.
That creates an important question: How confident should we be in the measures we use to identify communities with the greatest need?
The Reproducible Area Deprivation Index, or ReADI, offers an interesting new answer. ReADI updates the basic idea behind the Area Deprivation Index while making the process more reproducible, transparent, and adaptable to contemporary data.
For public health, that could be a significant development.
Build Your Public Health Issue
Tell us a little about your work, and we’ll build a personalized issue with five things worth knowing.
What Is the Reproducible Area Deprivation Index?
Area deprivation indices attempt to summarize multiple socioeconomic characteristics of a community into a single measure.
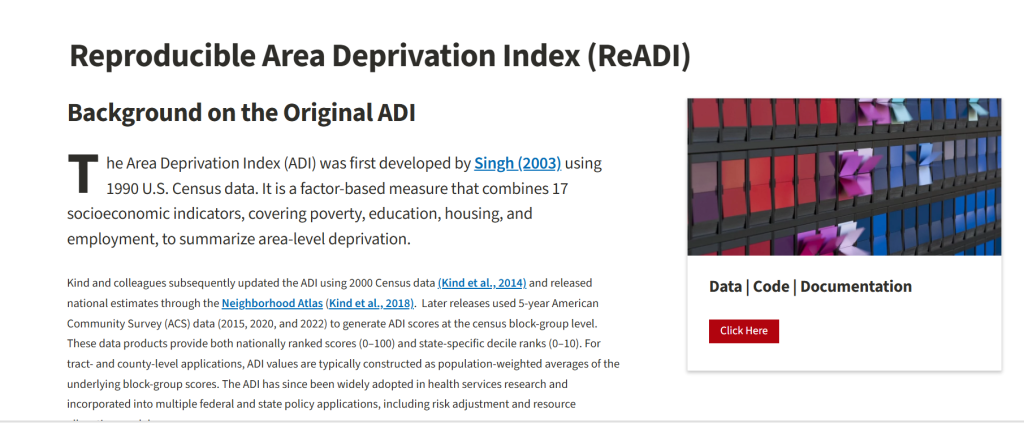
The original Area Deprivation Index grew out of work using 1990 Census data and combined 17 indicators related to income, poverty, education, employment, housing, and household conditions. Subsequent versions of ADI adapted this approach to newer Census and American Community Survey data.
ReADI retains the basic concept of measuring multidimensional socioeconomic deprivation but revisits how it constructs that measurement.
Its 17 contemporary indicators include measures such as median family income, poverty, educational attainment, unemployment, housing costs, home ownership, single-parent households, vehicle access, internet access, plumbing, and household crowding.
The important innovation is not simply the list of variables.
It is the process used to combine them.
Why Reproducibility Matters
A deprivation index can look deceptively simple once reduced to a score or percentile. Underneath that number are many methodological decisions.
- Which variables should be included?
- How should they be standardized?
- How much weight should each variable receive?
- Should relationships estimated using data from decades ago still determine how contemporary communities are scored?
- How should missing data be handled?
- How should differences in population size be treated?
These decisions matter because they can ultimately affect which communities appear disadvantaged and which do not. ReADI makes these decisions much more visible.
The published workflow retrieves contemporary American Community Survey data, constructs the component indicators, addresses missing values, standardizes measures, estimates a one-factor deprivation model, calculates factor scores, and converts those results into an interpretable national ranking.
Perhaps most importantly, the statistical weights used to construct ReADI are re-estimated using contemporary data rather than relying indefinitely on coefficients derived from historical Census data.
That makes ReADI something beyond another deprivation score. It is also a reproducible measurement framework.
For public health researchers, that means they can inspect and replicate the analysis. For agencies, it makes it possible to update the measure as communities change. For analysts, it makes it possible to test whether methodological decisions meaningfully affect the communities being identified.
Why This Matters for Public Health
The practical importance becomes clearer when deprivation measures move from research into decision-making.
Imagine that a health system wants to identify communities for a new community health initiative. A foundation wants to establish geographic eligibility for grants. A state health department wants to identify areas requiring additional outreach. A federal program wants to target technical assistance.
Eventually, a threshold must be drawn somewhere.
Our own recent research on geographic eligibility illustrates why this can become difficult. We compared the Community Deprivation Index, Social Vulnerability Index, Area Deprivation Index, persistent poverty, medical debt, uninsured rates, and health indicators to examine how different definitions of community need affect geographic targeting.
The measures were clearly related. They did not identify exactly the same places.
Different Indices See Different Kinds of Need
In our analyses, communities simultaneously identified as highly disadvantaged by multiple indices generally experienced the greatest health and social burden.
For example, census tracts classified as high on both CDI and SVI had substantially higher levels of poor self-rated health, disability, and stroke than communities falling below both thresholds.
Disagreements between indices were equally informative.
CDI more frequently identified communities experiencing concentrated socioeconomic disadvantage and persistent poverty. SVI identified additional urban communities characterized by factors such as housing burden, crowding, limited vehicle access, and limited English proficiency.
ADI identified another somewhat different geography, including more rural communities experiencing socioeconomic disadvantage.
In other words, two indices can correlate strongly nationally while disagreeing about particular communities.
That is one reason early findings showing strong relationships between ReADI and CDC PLACES health measures are encouraging but should be treated as the beginning of the validation process rather than its endpoint.
The next question is: “What does ReADI identify that our existing measures do not?”
ReADI Creates an Opportunity for Better Validation
This is where ReADI could become especially valuable for public health. A useful validation study could place ReADI alongside ADI, CDI, and SVI and examine their relationships with independently measured outcomes.
CDC PLACES provides an obvious starting point. Researchers could examine whether communities with greater ReADI deprivation also experience higher prevalence of poor self-rated health, disability, stroke, diabetes, cardiovascular disease, depression, and other health outcomes.
Financial vulnerability provides another test. Our geographic eligibility research found that deprivation was related to medical debt and lack of health insurance, but these concepts were not interchangeable. Uninsured burden provided information about financial vulnerability beyond what deprivation measures alone captured.
The same question could be asked of ReADI.
- Does ReADI identify counties experiencing high medical debt?
- Does it identify places with high uninsured rates?
- Does it outperform, complement, or simply reproduce the geographic patterns identified by existing deprivation indices?
- And where the measures disagree, what is different about those communities?
Those disagreement cases may ultimately tell us more than another national correlation coefficient.
From Measurement to Geographic Decision-Making
There is another important distinction public health practitioners should make.
A deprivation index describes community conditions. An eligibility framework makes a decision about those conditions.
Our analyses demonstrated how consequential this distinction can become. Using a CDI threshold of 75 plus persistent poverty produced a substantially different eligible geography than using a threshold of 60 plus persistent poverty. Lowering the threshold recovered tens of millions of residents and substantially increased identification of financially vulnerable communities.
The underlying deprivation data had not changed.
The decision rule had. ReADI will face the same challenge if it is used operationally. A ReADI percentile of 80 does not inherently mean that a community should receive funding while a community at 79 should not. The threshold represents a policy decision layered on top of a measurement system.
Public health organizations therefore need to validate both pieces: the measure and the decision rule built from it.
Moving Beyond Eligible Versus Ineligible
ReADI may also serve a better purpose than drawing another line on a map.
Our geographic eligibility research suggests that community need is better represented as overlapping dimensions of vulnerability.
We developed a composite framework incorporating deprivation, social vulnerability, persistent poverty, medical debt, and uninsured burden. As these vulnerabilities accumulated, communities showed progressively greater social and financial disadvantage.
That opens an intriguing possibility for ReADI. Instead of asking whether a community is simply “high ReADI” or “low ReADI,” public health organizations could use ReADI as one layer within a broader community intelligence system.
A community might experience high structural deprivation, high uninsured burden, and poor health outcomes. Another might experience moderate deprivation but unusually high medical debt. A third might have moderate socioeconomic deprivation while experiencing substantial housing, transportation, or linguistic vulnerability.
Those communities may require different interventions even if they ultimately qualify for the same program.
What Could Public Health Do With ReADI?
ReADI’s reproducible nature enables several applications.
Public health agencies could build interactive maps that allow practitioners to examine deprivation alongside local health outcomes. Health systems could incorporate ReADI into community health needs assessments. Researchers could examine how deprivation changes across successive ACS periods. Grantmakers could test proposed geographic eligibility thresholds before implementing them.
ReADI could also support something that static deprivation rankings rarely provide: explanation.
Because the methodology and component measures are available, an interactive public health tool could show users not only that a community has elevated deprivation, but also the conditions contributing to that pattern.
- Is housing affordability driving the score?
- Is educational disadvantage particularly high?
- Does the community have unusually low vehicle or internet access?
- How does the community compare with neighboring areas?
- How do those conditions align with diabetes, cardiovascular disease, mental health, insurance coverage, or other local public health concerns?
That transition from ranking communities to understanding communities may ultimately be the most valuable contribution of a reproducible deprivation framework.
Important Questions Remain
ReADI still requires further validation. American Community Survey estimates can be noisy at small geographic levels, particularly for small populations. Spatial imputation of missing observations introduces assumptions that warrant examination. Re-estimating statistical weights using each new data period improves contemporaneous measurement but also raises questions about comparability across time. Researchers should also examine whether the index behaves consistently across urban, suburban, rural, and frontier communities.
And, as with every area-level index, ReADI describes places rather than individuals. A person living in a highly deprived census tract is not necessarily personally disadvantaged, and an affluent community can still contain residents experiencing substantial hardship.
These are not reasons to avoid ReADI. They are questions a transparent, reproducible methodology makes possible to investigate.
The Bigger Opportunity: Public Health Data We Can Actually Use
ReADI arrives at an important moment for public health data science.
We have increasingly sophisticated methods for measuring community conditions. We have national datasets describing health outcomes, insurance coverage, poverty, medical debt, housing, demographics, and social vulnerability.
The larger challenge is turning those datasets into decisions people can understand and defend.
ReADI provides a promising foundation because its methodology can be reproduced, examined, updated, and challenged.
The next phase should be rigorous validation against health and financial outcomes, direct comparison with existing deprivation measures, and careful study of the communities where those measures disagree.
From there, the most interesting opportunity may be moving beyond another national deprivation ranking altogether.
We can begin building systems that help public health practitioners understand where need is concentrated, which vulnerabilities overlap, why particular communities are being identified, and what those patterns suggest for action.
That would make deprivation indices much more than numbers on a map.
It would make them tools for public health decision-making.