
Why Your Statistical Model Might Be Misleading You (And What Public Health Practitioners Should Do About It)
Public health decisions depend on data. But what if the way we analyze that data is quietly leading us in the wrong direction?
A recent commentary highlights a surprisingly common issue in public health research: many studies use the wrong statistical models—or interpret them incorrectly—when working with simple yes/no outcomes like depression, substance use, or access to care.
This might sound like a technical problem for statisticians. It’s not. It has real consequences for how practitioners understand risk, allocate resources, and design interventions.
Let’s break down why this matters—and what you can do about it.
The Hidden Problem: When “Standard Practice” Goes Wrong
In public health, researchers often rely on logistic regression to analyze binary outcomes (e.g., “has diabetes” vs. “does not”). But here’s the issue:
- Logistic regression produces odds ratios
- Practitioners often interpret those as risk or probability
And those are not the same thing. When outcomes are common. which is often the case in public health—this mismatch can inflate the apparent strength of the relationship.
Why this matters in practice
Imagine you’re evaluating a program targeting depression:
- A study reports that a group has “2.5 times higher odds” of depression
- That might sound like a massive increase in risk
But if depression is already common in the population, that number may overstate the real-world impact
That can lead to:
- Misplaced urgency
- Misallocated funding
- Misleading communication with stakeholders
Odds vs. Risk: A Simple but Critical Distinction
Let’s simplify:
- Risk (or prevalence) = How many people actually have the condition
- Odds = The ratio of having vs. not having the condition
When conditions are rare, odds and risk are similar. When they are common, they diverge—sometimes dramatically.
Real-world takeaway
If you’re reading research:
- Be cautious when you see “odds ratios.”
- Ask: Is this being interpreted correctly?
If you’re producing research:
- Be precise in your language
- Avoid saying “probability” when you mean “odds”
The Better Approach: Match the Model to the Data
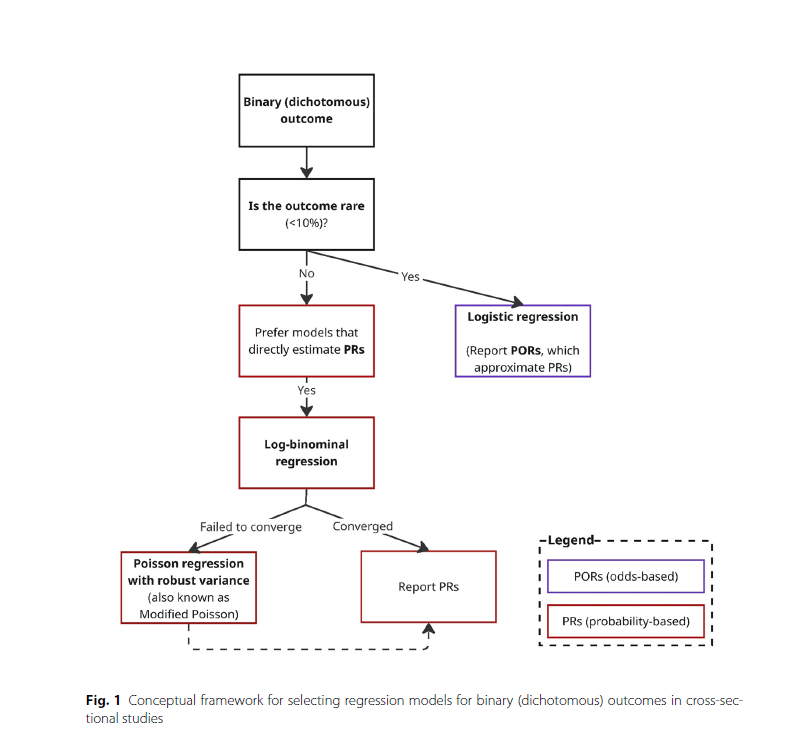
The article proposes a practical framework for choosing the right model based on how common the outcome is.
If the outcome is rare (<10%)
- Logistic regression is fine
- Odds ratios closely approximate risk
If the outcome is common (>10%)
- Use models that estimate prevalence ratios directly, such as:
- Log-binomial regression
- Modified Poisson regression
If you’re unsure
- Compare results from multiple models
- Prioritize interpretability for your audience
The decision tree on page 4 of the article clearly shows this step-by-step process, guiding researchers from identifying outcome prevalence to selecting the most appropriate model.
A Common Misunderstanding: “Modified Poisson” Isn’t for Counts
Another key takeaway: Modified Poisson regression is often misunderstood. Many assume it’s only for count data (like the number of hospital visits). In reality, it’s a powerful tool for binary outcomes, especially when:
- Outcomes are common
- Other models fail to converge
Why practitioners should care
If your evaluation team avoids this method because it “sounds wrong,” they may be:
- Limiting their analytical toolkit
- Producing less accurate estimates
Language Matters More Than You Think
The article also highlights a subtle but important issue: terminology errors. Two big ones:
1. Calling something “multivariate” when it’s “multivariable”
- Multivariable = one outcome, multiple predictors (most public health models)
- Multivariate = multiple outcomes
2. Confusing odds with probability
- This leads to miscommunication in reports and policy briefs
Why this matters
Public health is a field built on communication:
- With policymakers
- With communities
- Across disciplines
Using imprecise language can:
- Reduce trust
- Confuse stakeholders
- Undermine otherwise strong research
What This Means for Public Health Practice
This isn’t just about better statistics—it’s about better decisions.
1. Improve how you interpret research
When reading studies:
- Look beyond the headline numbers
- Ask how outcomes were modeled
- Be cautious with “odds” presented as “risk”
2. Strengthen your evaluation work
If you’re running programs:
- Ensure your analysts choose appropriate models
- Push for results that are easy to interpret (like prevalence ratios)
3. Communicate findings clearly
When sharing results:
- Use plain language
- Avoid overstating effects
- Be transparent about what numbers actually mean
The Bigger Picture: Better Data, Better Decisions
Public health is increasingly data-driven. That’s a good thing. But as this article shows, the tools we use and how we interpret them can shape the story the data tells. Small methodological choices can lead to:
- Big differences in perceived impact
- Shifts in policy priorities
- Changes in how communities are served
Getting the stats right isn’t just a technical issue. It’s a public health responsibility.
Final Thought
If your goal is to improve population health, your data needs to be both accurate and understandable.
That starts with asking a simple question: Are we using the right model—and telling the right story with it?