SVI vs. ADI: What Public Health Practitioners Need to Know Since the CDC Removed SVI
TLDR; SVI and ADI overlap but measure different concepts: vulnerability vs deprivation
Public health professionals often rely on composite indices to identify disadvantaged communities and guide interventions. Two prominent tools in this space are the Social Vulnerability Index (SVI) and the Area Deprivation Index (ADI). Both indices measure socioeconomic and demographic disadvantage, but they were created for different purposes and use distinct methodologies.
In this blog, we’ll explain what each index measures, where they overlap, and how they differ. We’ll also discuss whether ADI can serve as a replacement now that the CDC’s SVI has been removed from public websites, and highlight efforts by independent researchers to keep such indices available.
What Is the Social Vulnerability Index (SVI)?
The SVI is a composite index developed by the U.S. Centers for Disease Control and Prevention (CDC) and the Agency for Toxic Substances and Disease Registry (ATSDR) in 2011. It was designed as a tool to help emergency response planners and public health officials identify and map communities that are likely to require additional support before, during, and after disasters. In other words, SVI quantifies a community’s social vulnerability – the susceptibility of certain populations to harm from hazards or disease outbreaks based on underlying social and economic factors.
How SVI is Constructed: The CDC/ATSDR SVI uses data from the American Community Survey (ACS) and originally comprised 15 variables (expanded to 16 in recent updates) across four broad themes:
- Socioeconomic Status: e.g., poverty rate, unemployment, income level, education (percent without a high school diploma).
- Household Composition & Disability: e.g., percent of seniors (aged 65+), children (aged 17 and under), persons with disabilities, single-parent households.
- Minority Status & Language: e.g., percent racial/ethnic minority and percent who speak English “less than well.”
- Housing Type & Transportation: e.g., housing crowding, housing type (mobile homes, multi-unit structures), lack of a vehicle, group quarters residency.
For each census tract in the U.S., these variables are percentile-ranked (usually within state or nationally) and combined into theme scores and an overall SVI score. Higher SVI indicates greater vulnerability, meaning that a community is more likely to experience serious impacts from crises (e.g., injuries, loss) due to underlying social factors. The SVI is provided at the census tract level (and also aggregated to the county level), with percentile rankings available by state and nationally.
Use of SVI in Practice: SVI quickly became a widely used indicator in public health emergency planning and research. Emergency managers use SVI maps to plan evacuations and resource distribution, and health departments have used SVI maps to identify areas for emergency shelters and vaccine clinics.
For example, during the COVID-19 pandemic, many states prioritized high-SVI communities for vaccine outreach, citing the ease of use and public availability of SVI. SVI has also been used to study health outcomes; researchers have linked higher SVI to worse outcomes in surgery, environmental exposure, cardiovascular disease, and more. In short, SVI has become a staple tool for identifying vulnerable communities in both disaster response and general public health strategies.
Recent Developments:
In early 2025, the CDC abruptly removed the SVI data and tool from its websites as part of a broader dataset removal. This meant that official support for SVI was suspended, leaving practitioners scrambling for alternatives.
The stated purpose of SVI to help target support to at-risk communities clashed with a policy shift to eliminate certain demographic data from federal tools.
😑
The removal of this “vital taxpayer-funded resource” prompted outcry in the public health community. As one commentator put it, “Public health data should never be suppressed… when public health and safety are at stake, it is essential to rely on facts to develop data-driven responses.”. In the wake of SVI’s disappearance, attention turned to other indices, such as the ADI, and to efforts to replicate SVI independently (more on that later).
What Is the Area Deprivation Index (ADI)?
The ADI is another composite measure of community disadvantage, originally developed by Dr. Gurpreet Singh in 2003 (using 1990 Census data) to quantify area-level deprivation in the U.S. The concept of deprivation centers on the lack of resources and opportunities within a given area. The ADI was later adapted by researchers at the University of Wisconsin–Madison, who released a Neighborhood Atlas in 2018 with ADI scores for every neighborhood (census block group) in the country. This brought ADI into broad public use in health research and policy.
How ADI is Constructed: The ADI aggregates 17 socioeconomic indicators from the Census/ACS across the following domains: income, education, employment, housing quality, and housing crowding. Some examples of ADI variables include:
- Income and Employment: Median family income, poverty rate, unemployment rate, and income disparity.
- Education: The percentage of adults with less than a 9th-grade education and with less than a high school diploma.
- Housing Quality and Access: Median home value, median rent, percent of homes lacking plumbing, percent lacking telephone service, and households with more than one person per room (crowding).
- Housing Tenure/Type: Percent of housing that is owner-occupied vs. rented, percent of single-unit vs. multi-unit structures, percent of mobile homes.
- Household Composition: Single-parent household percentage.
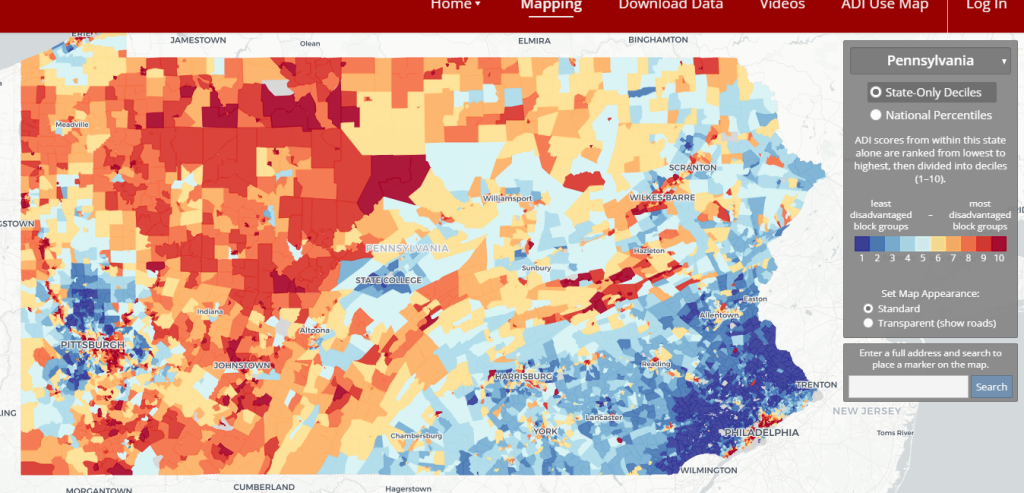
Each block group’s data on these 17 factors is combined (originally via principal components analysis, yielding a weighted composite score) to produce an overall ADI score. These scores are then ranked into percentiles on a national scale – an ADI at the 85th percentile, for instance, means the area is among the 15% most deprived neighborhoods in the country. Higher ADI indicates greater deprivation (i.e., greater disadvantage).
Use of the ADI in Practice: The ADI has gained traction in health equity research and policy. In fact, more than 1,000 peer-reviewed studies have used the ADI to examine health outcomes. It has been associated with hospital readmission rates (e.g., patients from high-ADI neighborhoods have higher 30-day rehospitalization) and other health measures. Recently, the U.S. Centers for Medicare & Medicaid Services (CMS) incorporated ADI into payment models: for example, Medicare now provides bonus payments to Accountable Care Organizations serving high-ADI communities (85th percentile and above). This policy employs ADI to identify underserved areas in need of additional resources.
The ADI’s emphasis on socioeconomic factors (without directly using race or ethnicity) made it a candidate for widespread adoption in programs addressing social determinants of health. However, as ADI has become more influential, researchers have debated its methodology (more on that shortly).
Overlap Between SVI and ADI
| Features | CDC Social Vulnerability Index (SVI) | Area Deprivation Index (ADI) |
|---|---|---|
| Developer & Purpose | Developed by CDC/ATSDR (2011) to identify communities likely to need support in emergencies. Primarily a disaster preparedness and public health emergency planning tool. | Developed by G. Singh (2003) and UW–Madison (Neighborhood Atlas, 2018) as a measure of socioeconomic deprivation. Used broadly for health disparities research and policy targeting of resource gaps. |
| Geographic Scale | Census block group level (smaller neighborhoods of ~1,000 people). ADI scores are typically reported as national percentiles (and state-level deciles). | Census block group level (smaller neighborhoods of ~1,000 people). ADI scores are typically given as national percentiles (and deciles by state). |
| Data Inputs | 16 indicators from ACS covering 4 themes: Socioeconomic status, Household composition (incl. age and disability), Minority status & Language, and Housing/Transportation. Draws on demographics and basic housing needs. | 17 indicators from ACS covering domains of income, poverty, education, employment, housing quality, and crowding. Emphasizes economic and material deprivation factors. |
| Notable Components | Simple percentile ranking method: Each variable is percentile-ranked (usually within the state), summed into theme scores and an overall score, and then ranked again as the overall SVI percentile. All variables are weighted equally within the index (implicitly). | Includes variables capturing neighborhood disadvantage: e.g. median household income, housing costs (home value, rent, mortgage), % homes without plumbing or telephone, education levels†. Also includes poverty, unemployment, lack of a vehicle, crowding, etc. Race or ethnicity is not a component of focus (the focus is on socioeconomic status). |
| Methodology | Simple percentile ranking method: Each variable is percentile-ranked (usually within state), summed into theme scores and an overall score, which is then ranked again as the overall SVI percentile. All variables are weighted equally within the index (implicitly). | Principal components analysis (PCA) method: original ADI is a weighted sum of the 17 variables using factor loadings derived from 1990 data. The Neighborhood Atlas provides ADI as a precomputed national percentile based on this composite. (Recent versions made minor tweaks, like variance stabilization for ACS estimates.) |
| Latest Availability | CDC SVI 2020 (using 2016–2020 ACS 5-year data) was released in 2022. As of Jan 2025, CDC has removed SVI data from public sites, and future updates are uncertain. Historically updated every 2 years by CDC GRASP. | Neighborhood Atlas ADI v4 (2023) uses 2016–2020 ACS data. ADI is actively maintained by UW–Madison and has been updated through multiple versions; it remains publicly accessible via the Neighborhood Atlas website. |
| Example Use Cases | – Emergency preparedness: locating where to open shelters, send emergency medical teams, etc. – Pandemic response: Many states used SVI to allocate COVID-19 vaccines to high-need areas. – Health care outreach: used by health plans to identify members facing barriers (e.g. lack of transport) and tailor interventions. | – Health research: predicting hospital readmission or mortality based on neighborhood deprivation. – Policy & funding: CMS uses ADI (top 15% cutoff) to direct resources to high-deprivation areas in Medicare value-based programs. – Community health needs assessments to pinpoint socioeconomically disadvantaged neighborhoods for intervention. |
SVI and ADI overlap significantly in that both aim to capture a community’s underlying social and economic challenges. Both indices incorporate core determinants such as poverty, employment, education, and housing conditions, though they are measured with slight differences. In fact, a recent study noted that many variables recur across various disadvantage indices; thus, indices such as SVI and ADI tend to be moderately correlated. For example, both SVI and ADI include:
- Poverty level: Percent of people or families below poverty (SVI measures below 150% of poverty, ADI includes below 100% and 150% poverty thresholds).
- Unemployment rate: Both include the percentage of unemployed adults.
- Vehicle access: Both include the percentage of households without a vehicle (a proxy for transportation disadvantage).
- Housing crowding: Both include percent of households with more than one person per room.
- Single-parent households: Both include the percentage of single-parent families, capturing the family support structure.
Given these similarities, it’s not surprising that SVI and ADI often identify many of the same neighborhoods as disadvantaged. A study comparing SVI, ADI, and another index found moderate agreement (Intra-Class Correlation of ~0.54 between SVI and ADI), indicating overlap, though not interchangeability. In practice, communities that rank highly on one index tend to rank highly on the other, particularly because factors such as poverty and unemployment strongly influence both.
Key Differences Between SVI and ADI
Despite the overlap, SVI and ADI have notable differences in emphasis and design:
Demographic Factors: SVI explicitly includes demographic vulnerability variables that ADI does not. These include the proportion of elderly and young residents, people with disabilities, racial/ethnic minorities, and those with limited English proficiency. These factors are important in disasters (e.g. language barriers or mobility issues can impede response). ADI, by contrast, does not directly include age, disability, or race (it is more purely economic). This means SVI captures some social dimensions (like racial minority status) that ADI omits by focusing on socioeconomic status alone.
Economic and Housing Quality Indicators: ADI captures a broader range of economic hardship and housing quality. It includes measures such as median home value, median rent, median mortgage cost, lack of telephone service, and lack of plumbing in homes. These granular indicators of material deprivation are absent in SVI. SVI’s housing-related metrics are simpler (crowding, multi-unit structures, mobile homes, group quarters, vehicle access), and it doesn’t account for home values or utilities. In essence, ADI provides a more detailed examination of housing and infrastructure poverty, which SVI does not measure.
Geographic Detail: SVI is calculated at the census tract level, whereas ADI (Neighborhood Atlas version) is at the census block group level. Block groups are smaller and may capture micro-neighborhood differences. For practitioners, this means ADI can pinpoint disadvantage at a finer scale (useful in urban areas where inequality can vary by blocks). However, smaller units can exhibit greater data volatility; indeed, the ADI methodology had to address substantial margins of error in ACS estimates at the block-group level.
Methodological Approach: SVI uses a straightforward percentile-ranking and summing approach (treating each variable equally), whereas ADI’s original methodology uses weighted factors derived from principal components analysis. One practical implication is that SVI is easier to compute and explain – every input contributes comparably, whereas ADI’s scoring is more complex and can be harder to interpret (the weights give more influence to certain variables, like median home value, than others). There has been debate about the ADI methodology; for example, researchers have noted that the non-standardized PCA used in ADI tends to give median home value disproportionate weight in the score, potentially obscuring other aspects of deprivation. The ADI creators responded by citing the index’s validation in hundreds of studies. Nevertheless, this technical difference means that the two indices are not mathematically equivalent, even when they are fed with similar data.
Thematic Framing: SVI’s framing is “vulnerability” – who will likely need help in a crisis – which includes social factors that affect resilience (like language or disability). ADI’s framing is “deprivation” – chronic lack of socioeconomic resources in an area. This difference in intent is reflected in their components: SVI combines chronic social conditions with acute vulnerability factors, whereas ADI relies on long-term socioeconomic status indicators.
In summary, SVI provides a broader social vulnerability lens, encompassing factors related to who might be vulnerable (e.g., age, minority status), whereas ADI provides a deeper socioeconomic lens, focusing on the material resources or disadvantages an area has or lacks. Depending on the use case, one index may be more suitable than the other.
Which Index to Use Going Forward?
With the CDC’s SVI now offline (and potentially no longer updated), many practitioners wonder if the ADI can be used as a substitute. The answer depends on what you need the index for:
Emergency Planning and Response: SVI was designed for this purpose and includes language and disability considerations, which are crucial in emergency outreach. ADI, being more about general deprivation, might miss those nuances. However, in the absence of SVI, ADI can still identify economically stressed areas that are likely to struggle during disasters. It may be wise to supplement ADI with additional data on age, language, or disability for emergency planning, since ADI alone won’t flag, say, a community of mostly elderly residents. For example, one could use ADI to identify high-poverty neighborhoods and then overlay Census data on age 65+ populations or disability rates to approximate the SVI functionality.
Health Equity and Resource Allocation: ADI is already widely used in health research and policy, sometimes in lieu of SVI. For instance, a 2022 study found that SVI outperformed ADI in predicting certain health outcomes; SVI had greater discrimination in surgical outcome risk than ADI. This suggests SVI’s inclusion of additional social factors gave it an edge in that context. Despite this, policymakers have chosen ADI for programs such as Medicare because it’s perceived as purely socioeconomic. If you’re looking at health outcomes (hospitalizations, chronic disease burden, etc.), ADI is a solid choice, but be aware that it might understate risk in communities where social factors (like minority status or language barriers) play a big role in outcomes. In such cases, you might miss something by not having SVI. Some researchers recommend that studies using ADI be reinterpreted as largely capturing wealth (home value) effects, given the index’s weighting. Thus, practitioners should be cautious and perhaps consider multiple indices.
- Practical Availability and Updates: As of now, ADI is accessible and maintained, whereas SVI is pending. The Neighborhood Atlas provides easy downloads of ADI percentiles nationwide, updated to the latest ACS data. If your work depends on having the latest data, ADI (or other alternatives) will be the go-to. It’s also worth noting that the CDC’s removal of SVI may not be permanent, but there’s no guarantee it will return or be updated. In the meantime, using ADI is a practical approach to developing a national, standardized index of area disadvantage.
In short, can ADI replace SVI? For many uses, yes, especially those focused on socioeconomic deprivation. ADI will correctly identify high-poverty, high-need areas in most cases. However, practitioners should remember what ADI omits. If those omitted factors are important for your application, you’ll need to account for them separately. For example, a health department planning multilingual risk communication would find SVI’s language data essential; using ADI alone, they’d need to obtain language-proficiency data elsewhere.
Alternative Indices and SVI Replication Efforts
The retirement of SVI from the official stage has spurred independent efforts to replicate and preserve the index. One notable project is an open-source R package called findSVI, developed by researchers at Drexel University. This package reverse-engineers the SVI methodology and enables users to calculate SVI scores for any year of ACS data and at multiple geographic levels (not only tracts but also ZIP codes, etc.). With findSVI, analysts can continue to produce SVI-like measures and customize the geographic scope (e.g., generating SVI for specific cities or across multiple states). The motivation for this tool was to extend SVI’s utility and keep it up to date in a reproducible manner, given that the CDC’s official updates were infrequent and may now be discontinued.
Beyond SVI replication, there are other indices that could fill parts of the gap:
- Social Deprivation Index (SDI): An index developed by the Robert Graham Center, focusing on similar social determinants (it has fewer variables than SVI/ADI, emphasizing poverty, education, single-parent households, etc.). Studies have shown SDI correlates highly with SVI. Some researchers maintain updated SDI scores.
- Environmental Justice Index (EJI): Recently, the CDC/ATSDR introduced an Environmental Justice Index that builds on the SVI and incorporates environmental burden factors. EJI may become a new supported tool, but it’s more focused on environmental hazard vulnerability than on purely social factors.
- Revised ADI (ReADI): Given the criticisms of the ADI’s methodology, a team at Stanford launched a “Reproducible ADI” to address methodological issues (standardizing the inputs, updating thresholds). This is more of a tweak to ADI than a new index, but it underscores that indices continue to evolve.
For now, if you were a heavy SVI user, you have options: use ADI (with caution regarding its differences) or generate your own SVI using available data and tools such as findSVI. The good news is that the underlying data (ACS demographics, etc.) are public, so nothing truly prevents creating an SVI-equivalent – it’s mostly about convenience and consistency. In fact, the Stanford Socioeconomic Indices Project has centralized many of these indices (including documentation to recreate older versions) to ensure they remain available to researchers and practitioners.
Conclusion
Both the Social Vulnerability Index and Area Deprivation Index are valuable for pinpointing communities in need, but they are not identical. SVI offers a broader socio-demographic vulnerability perspective, developed in response to disaster management needs, whereas ADI offers a focused socioeconomic deprivation perspective, rooted in poverty and housing conditions. They often highlight similar geographic areas as disadvantaged, yet differences in their composition can lead to different conclusions in certain contexts (as evidenced by research in which SVI sometimes outperforms ADI in explaining health outcomes).
For practitioners, the loss of CDC-supported SVI is certainly a setback – the index was an “essential tool” linking social conditions to health. However, the ADI provides a ready alternative that is widely accepted and continues to be updated. By understanding the overlaps and gaps between SVI and ADI, you can adjust your approach: use ADI to capture core deprivation and supplement it as needed with additional data on vulnerable populations.
Lastly, the situation has shown the importance of open, reproducible data tools. Independent researchers have stepped up to ensure that social vulnerability metrics remain accessible, whether through open-source packages or academic initiatives. As one Lancet commentary noted, “There are alternatives that can support health systems, researchers, public health professionals, and policy makers if SVI is permanently removed.” In other words, while the names of the indices may change, our commitment to using data to advance equity should remain unwavering. Whether you end up using ADI, a DIY SVI, or another index, the key is to keep leveraging these tools to identify at-risk communities and to allocate resources where they’re needed most – because you can’t manage what you don’t measure.
Sources:
- CDC/ATSDR. Social Vulnerability Index (SVI) – Overview & Methodology. CDC Place and Health, updated 2024.
- Newsom J. “Gone in an instant – CDC data at large.” Engagys Blog. Feb 3, 2025.
- Xu H, Li R, Bilal U. “findSVI: an R package to calculate the Social Vulnerability Index at multiple geographical levels.” J. Open Source Software. 2024.
- Kind AJH, Buckingham WR. “Making Neighborhood Disadvantage Count: The Area Deprivation Index.” Annals of Intern Med. 2014;161(11):765-773.
- Ahmed F, et al. “Comparison of Social Vulnerability, Area Deprivation, and Social Deprivation Indices in EMS Outcomes.” Annals of Emergency Medicine. 2024 (data from 2023).
- Khazanchi R, et al. “Comparing Deprivation vs Vulnerability Index Performance Using Medicare Beneficiary Surgical Outcomes.” JAMA Surgery. 2022.
- Rehkopf DH. “Deciphering the Neighborhood Atlas ADI: consequences of not standardizing.” JAMA Network Open. 2023;6(4):e237481.
- Stanford University. Socioeconomic Position Indices (SEPI) – ADI and SVI pages. Accessed 2025.
- Azar A, et al. “Assessment of ADI vs life expectancy in New York City.” Health Affairs. 2023 (debate referenced in Rehkopf 2023).