
Medical Debt Isn’t Equal
New Data Shows Where Racial Disparities Hit Hardest in the U.S
Medical debt is one of the most widespread and least understood forms of financial hardship in the United States.
Even insured Americans frequently face unexpected medical bills, and millions of households carry healthcare-related debt in collections. But one question remains critically important for public health professionals:
Who bears the greatest burden of medical debt?
A new county-level analysis of communities serviced by non-profit hospitals reveals a clear pattern: communities of color consistently face higher medical debt burdens, and those disparities grow larger in socially vulnerable communities.
Understanding where these inequities occur can help policymakers, health systems, and public health organizations target interventions more effectively.
The Hidden Public Health Consequences of Medical Debt
Medical debt does more than affect household finances. Research shows it can lead to:
- delayed medical care
- reduced medication adherence
- long-term financial instability
- poorer mental health outcomes
When medical debt accumulates disproportionately in certain communities, it becomes not just a financial issue but a structural public health problem. To better understand how these disparities play out geographically, we analyzed county-level indicators related to medical debt, insurance coverage, and socioeconomic vulnerability.
How We Analyzed Medical Debt Disparities
The analysis combined multiple county-level indicators:
- Share of residents with medical debt in collections
- Insurance coverage rates
- Household income
- The CDC Social Vulnerability Index (SVI)
We then calculated a key metric: Medical Debt Disparity
Debt Gap =
Share of residents with medical debt in communities of color
−
Share of residents with medical debt in white communities
Positive values indicate that communities of color experience higher levels of medical debt within a county. Across more than 4,500 observations, we examined how these disparities varied across geography, social vulnerability, and rural versus urban communities.
What We Found: National Disparities Are Clear
At the national level, disparities are already evident. On average:
- Communities of color had 1.8 percentage points more medical debt in collections
- Uninsured rates were 5.6 percentage points higher
- Average household income was $27,000 lower
These differences reflect structural inequalities that shape access to healthcare and financial resilience.
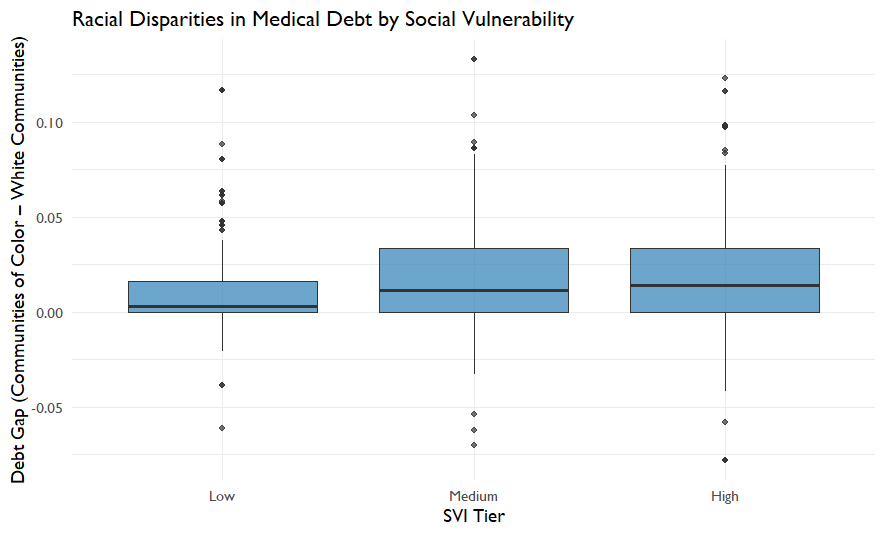
Social Vulnerability Amplifies Debt Inequality
One of the strongest patterns emerged when counties were grouped by Social Vulnerability Index (SVI). Counties with higher vulnerability showed larger disparities.
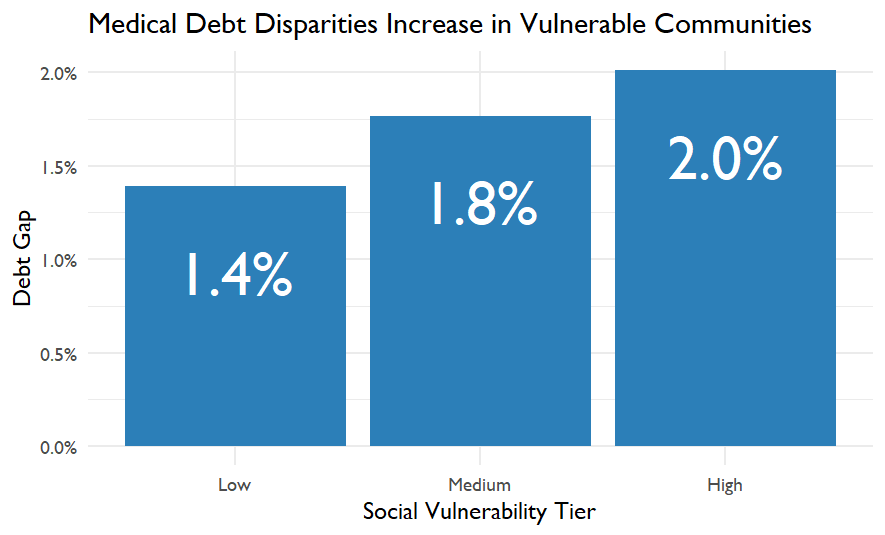
| SVI Tier | Medical Debt Gap |
|---|---|
| Low vulnerability | 1.4% |
| Medium vulnerability | 1.8% |
| High vulnerability | 2.0% |
This pattern suggests that structural vulnerability compounds financial health risks. Communities facing greater economic and social challenges are also more likely to experience unequal medical debt burdens.
Rural and Urban Patterns Look Different
When comparing rural and urban counties, an interesting pattern emerged.
| County Type | Medical Debt Gap |
|---|---|
| Urban counties | 1.86% |
| Rural counties | 0.84% |
Urban areas show larger racial disparities in medical debt, even though rural communities often face their own financial health challenges. This difference may reflect factors such as:
- demographic composition
- insurance coverage patterns
- healthcare access and pricing structures
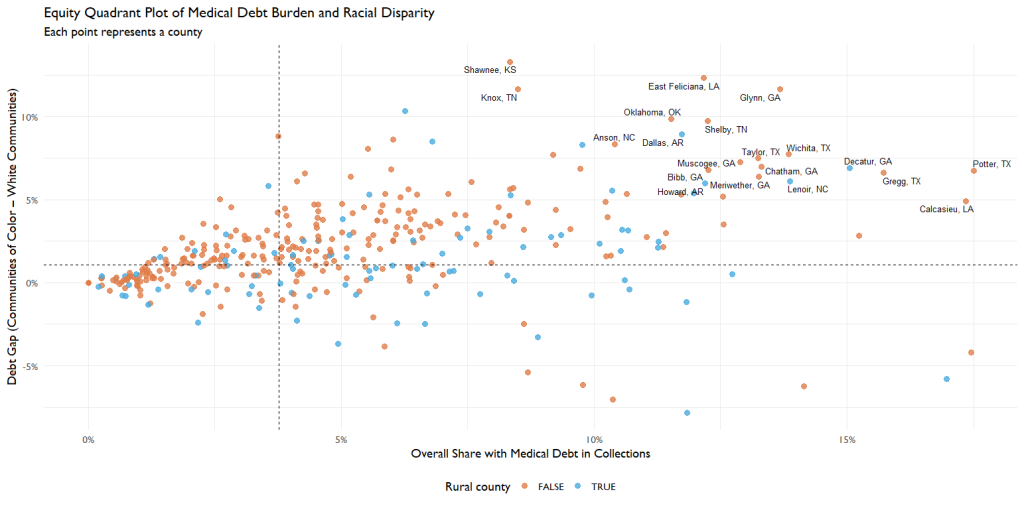
Four Types of Counties Emerge
To better understand these patterns, we grouped counties into four categories based on:
- Overall medical debt burden
- Racial disparity in medical debt
This created an equity quadrant framework.
| Category | Meaning |
|---|---|
| High debt / High disparity | Highest equity concern |
| High debt / Low disparity | Widespread financial strain |
| Low debt / High disparity | Hidden inequality |
| Low debt / Low disparity | Lower relative burden |
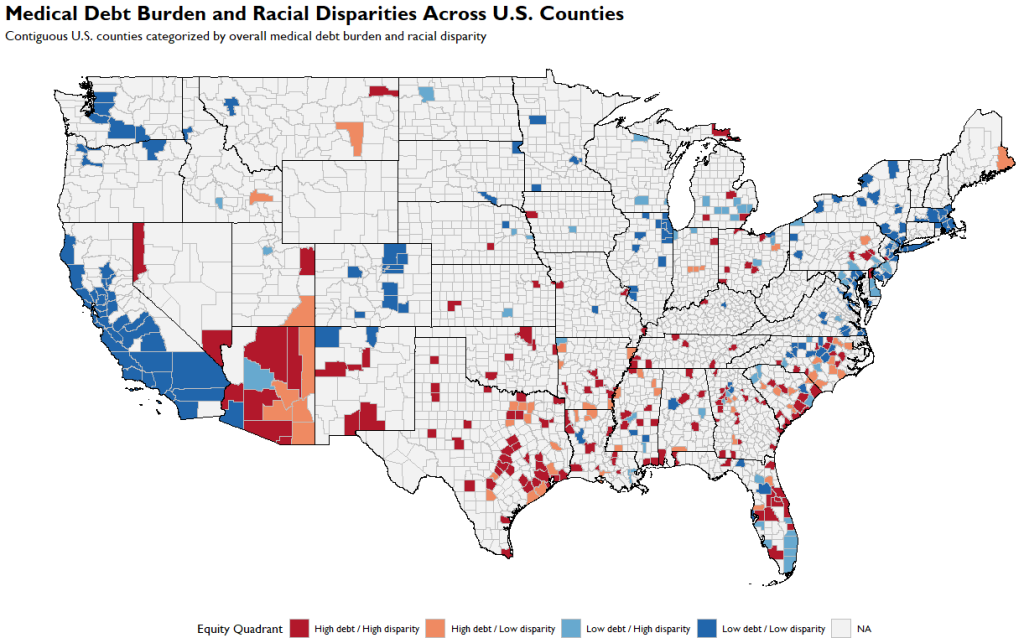
Mapping Where Medical Debt Inequality Lives
Finally, we mapped the results across the contiguous United States. The geographic patterns are striking. Certain regions show clusters of counties where:
- overall medical debt is high
- racial disparities are large
These locations represent priority areas for intervention.
What This Means for Public Health
The results highlight several key insights.
1. Medical debt is not evenly distributed
Communities of color consistently face higher medical debt burdens.
2. Structural vulnerability magnifies inequality
Counties with higher social vulnerability show larger disparities.
3. Insurance coverage gaps matter
Higher uninsured rates appear closely linked to disparities in medical debt.
4. Geography matters
Clusters of high-debt, high-disparity counties suggest opportunities for targeted policy interventions.
Where Do We Go From Here?
Medical debt is increasingly recognized as a public health issue, not just a financial one. Policies that could reduce these disparities include:
- expanding insurance coverage
- strengthening consumer protections
- addressing healthcare pricing
- targeting support to high-burden communities
Understanding where the burden is greatest is the first step toward designing effective solutions.
Final Thoughts
Medical debt represents a powerful intersection between health, economics, and structural inequality.
By examining county-level patterns, we can begin to see how broader systems shape who experiences financial hardship after seeking care. And as this analysis shows, those burdens still fall disproportionately on communities already facing significant challenges.
Reducing medical debt disparities will require not only healthcare reform, but also a sustained commitment to health equity.