Mapping High Social Vulnerability, Rural Poverty, and Healthcare Organizations
If you want to understand American healthcare, don’t start with hospital rankings. Start with geography.
We analyzed 4,523 non-profit healthcare organizations operating across 1,508 U.S. counties. For each county, we examined three structural markers: the CDC’s Social Vulnerability Index (SVI), rural classification, and the presence of high-poverty census tracts. The goal was simple. Are healthcare organizations operating in relatively stable environments, or are they embedded in structurally vulnerable communities?
The answer is clear. Healthcare delivery in the United States is deeply situated within structural vulnerability.
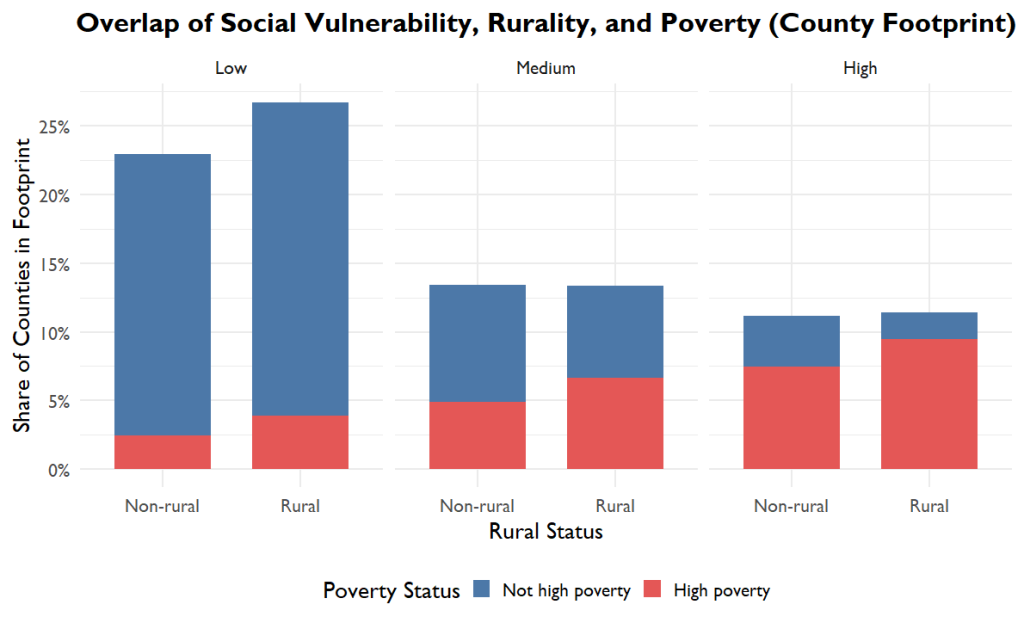
Across the system footprint, 22.5 percent of counties are classified as High Social Vulnerability under the SVI. More than half, 51.5 percent, are rural. Over one-third, 34.9 percent, contain census tracts with concentrated poverty. Taken together, fully 70 percent of counties where healthcare organizations operate exhibit at least one of these structural risk markers.
Seventy percent of counties in the system’s footprint exhibit at least one structural risk marker.
Structural vulnerability is not peripheral to healthcare delivery. It is the operating environment.
When we examine where organizations themselves are located, the exposure becomes even clearer. Nearly one-third of healthcare organizations, 32.7 percent, operate in high-SVI counties. Thirty-seven percent are located in counties with concentrated poverty. More than one-quarter operate in rural areas. In total, 64 percent of organizations are situated in counties with at least one major structural risk factor.
These numbers challenge a common assumption that healthcare systems function in neutral terrain. They do not. They function inside economic inequality, rural workforce shortages, transportation barriers, housing instability, and insurance gaps. Structural risk is not something healthcare providers encounter occasionally. It is something they manage daily.
Where Structural Vulnerability Clusters in the U.S.
The pattern becomes even more striking when we look at counties facing the most concentrated structural pressure. Roughly 9.5 percent of counties meet what we might call a “triple burden” threshold: High SVI, rural classification, and concentrated poverty simultaneously. Yet only 4.4 percent of healthcare organizations are located in these counties. The highest-risk communities are the least densely served.
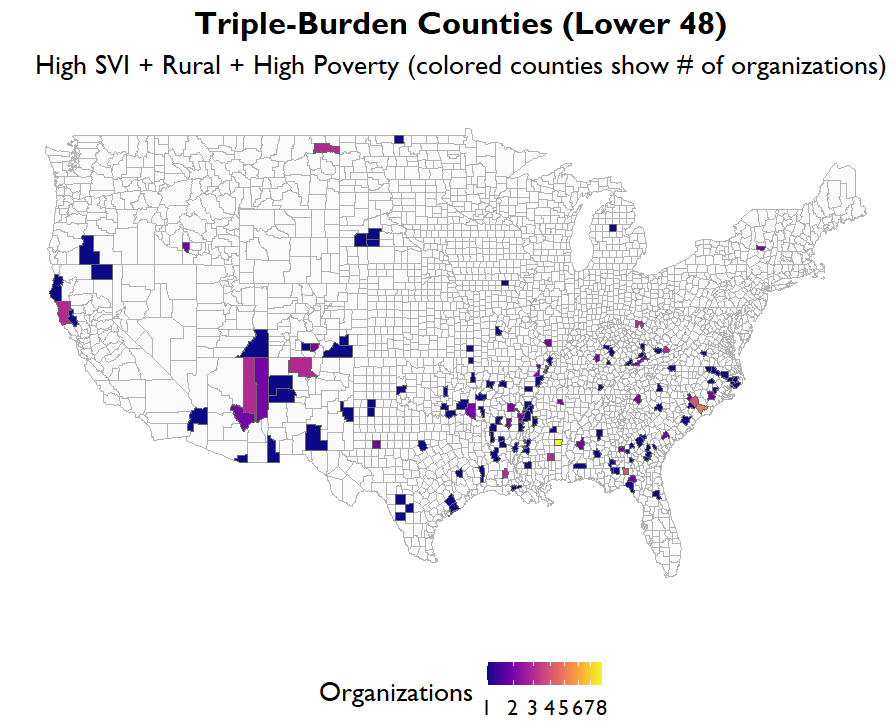
This is not an accusation. It is a structural reality. Rural counties often have smaller populations, fewer providers, and thinner financial margins. But it raises important questions about access, equity, and long-term sustainability. If the areas with the greatest structural risk overlap have fewer organizational resources, how should systems respond?
These findings matter for Community Health Needs Assessments (CHNAs), hospital community benefit strategies, and equity planning. CHNAs typically identify disease burdens, behavioral health needs, or access barriers. But this analysis suggests that planning should begin one layer earlier. Before asking about health problems, systems should ask what structural conditions define their service area.
When 70 percent of counties in a system’s footprint carry measurable structural vulnerability, equity cannot be treated as a side initiative. It must be embedded in budgeting, staffing models, partnership strategies, and capital investment decisions. Rural counties may require different care delivery approaches, including telehealth expansion or mobile clinics. High SVI counties may require deeper collaboration with community-based organizations. Counties with concentrated poverty may demand financial counseling services or debt mitigation strategies integrated into care.
The Social Vulnerability Index captures income, household composition, minority status, housing quality, and transportation access. Rural classification reflects geographic isolation and workforce constraints. Concentrated poverty signals chronic underinvestment and economic fragility. These are not abstract variables. They shape insurance coverage rates, medical debt patterns, emergency department utilization, and access to preventive care. They influence who delays care and who absorbs financial harm.
Strategy Must Match Geography
Healthcare systems do not float above social conditions. They are built into them.
When policymakers debate medical debt, rural hospital closures, workforce shortages, or health equity, they are not talking about isolated pockets of hardship. They are describing the dominant terrain in which healthcare organizations operate. In this analysis, 70 percent of counties in the system’s footprint carry at least one major structural risk marker. Vulnerability is not an edge case. It is the landscape.
That reality carries consequences. If capital planning, workforce models, community benefit spending, and CHNA priorities are designed as though structural vulnerability were occasional, the strategy will consistently underestimate need. Resources will be misaligned. Risk will be reactive instead of anticipated. Equity initiatives will feel supplemental rather than foundational.
The data make something visible that often remains implicit: healthcare delivery in America is structurally entangled with inequality. Recognizing that is not a political position. It is a geographic fact. And geography, unlike rhetoric, demands adaptation.
For more, check out our work on SVI and ADI